- The S&P 500 fell 8.61% on the week to 6,910.39, its lowest close since Apr 13, with 7,000 just overhead as the pivot and Friday's 6,882.66 low and the Apr 13 low at 6,790 below.
- The Nasdaq 100 lagged with a 10.43% drop to 25,028.98, about 10.8% under its 200-day average, closing just above 25,000 with Friday's open gap from 26,429 to 26,482 overhead.
- Nvidia fell 22.76% to 125.79 and AMD 20.57% to 424.21; the pivot that matters most is the S&P's 7,000, and Wednesday's 8:30 AM ET GDP and inflation data land before Thursday's holiday.
Key numbers
Levels to watch
- 7,348.58RESISTANCE200-day average, lost on Tuesday's close and still rising
- 7,173.63RESISTANCEThursday's low, which Friday's open gapped under; Friday's high stopped at 7,198.67
- 7,000PIVOTRound number and the strike with by far the most open interest, about 2.8 million contracts; Friday broke it and closed about 1.3% below
- 6,882.66SUPPORTFriday's low, the bottom of the three-month chart
- 6,790.02SUPPORTApr 13 low, near the 6,800 strike with heavy puts; the April gap below it runs from 6,740 down to 6,618
- 28,073.30RESISTANCE200-day average, about 10.8% above Friday's close
- 26,481.82RESISTANCEThursday's low, the top of Friday's open gap down to 26,429.09
- 25,000PIVOTRound number and the strike with the second-most open interest, mostly puts; Friday's low at 24,910.48 dipped under it and the close held 29 points above
- 24,756.93SUPPORTTop of the Apr 8 gap, still open down to 24,209.28
- 148.80RESISTANCENov 12 low, the support on last week's board, near the 150 strike with the most open interest
- 143.73RESISTANCEFriday's high, the bottom of Friday's open gap up to Thursday's 145.71 low
- 130.00PIVOTRound number with heavy put open interest; Friday opened at 143.52 and sliced through it, and the evening session traded back near it
- 124.50SUPPORTFriday's low, the lowest price on the stock's chart since at least July 2025
- 120.00SUPPORTRound number and a strike with about 360,000 puts open
- 500.00RESISTANCERound number and the strike with the second-most open interest, last week's support
- 474.79RESISTANCEFriday's high, under Thursday's 489.19 close
- 429.79PIVOT200-day average, held on every close from Nov 6 through Thursday; the 430 strike sits on it
- 402.10SUPPORTNov 5 low, the bottom of the three-month chart, near the 400 strike with the most open interest
Get the Desk's features and the market mood in your inbox. Free.
One feature a day, every day. Free. Unsubscribe anytime.
Every chart on this board ended the week at or near its lows. The S&P 500 fell 8.61% to 6,910.39, broke the 7,000 line in Friday's 3.70% drop and closed about 6.0% under its 200-day average. The Nasdaq 100 fell 10.43% to 25,028.98, about 20.2% under its Oct 6 high, and held 25,000 by 29 points. Both made their lowest closes since April, and both left Friday's open gaps overhead.
The S&P 500
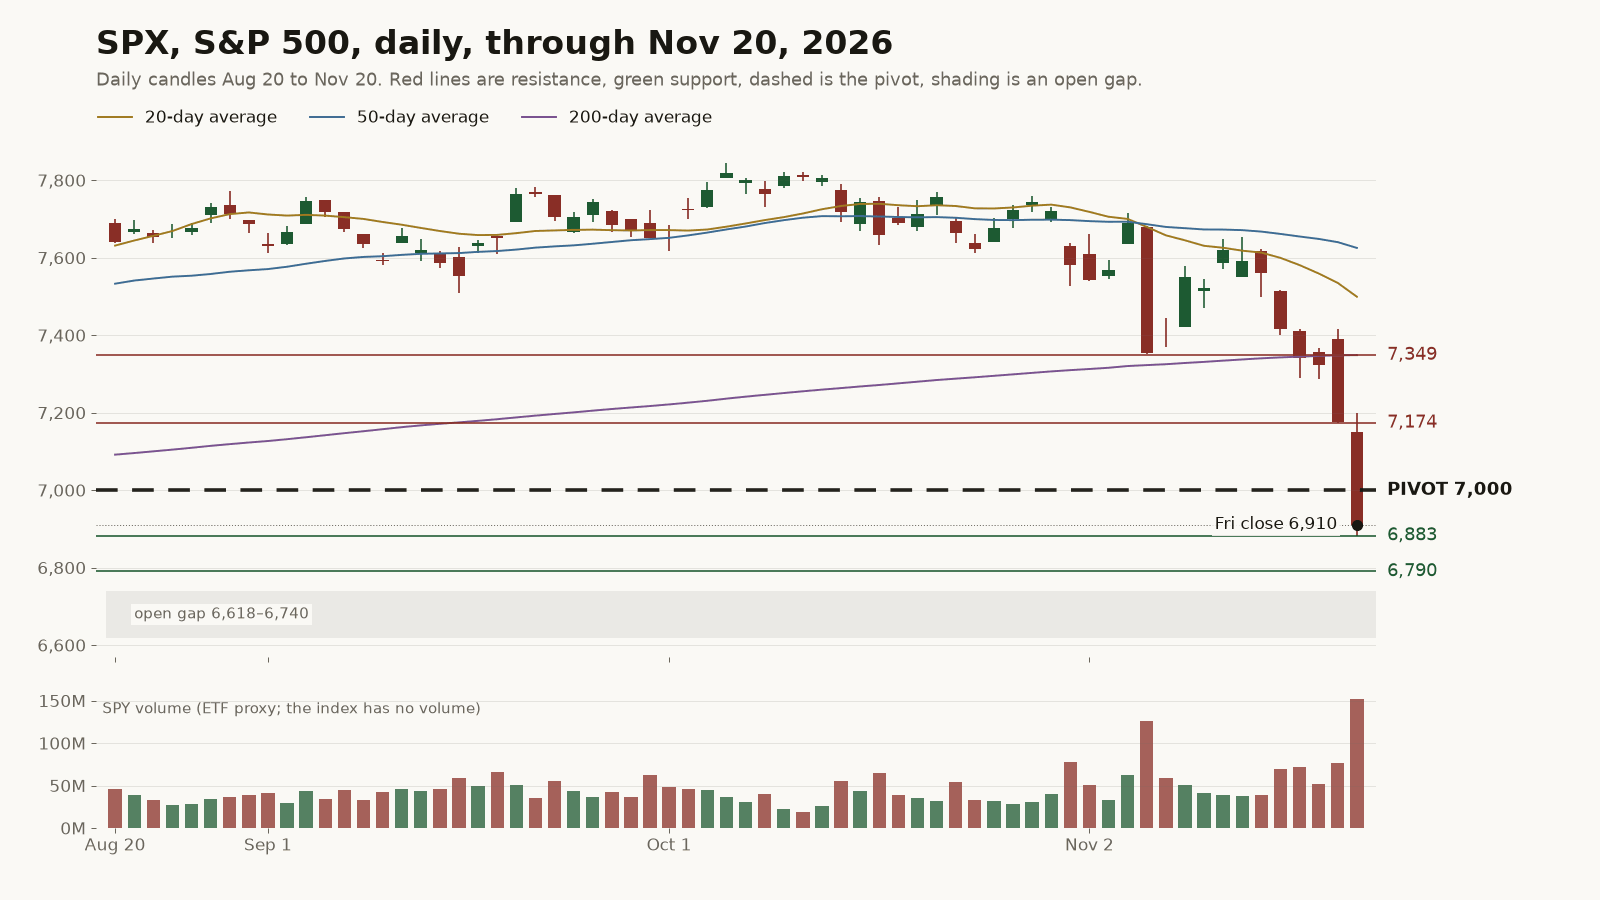
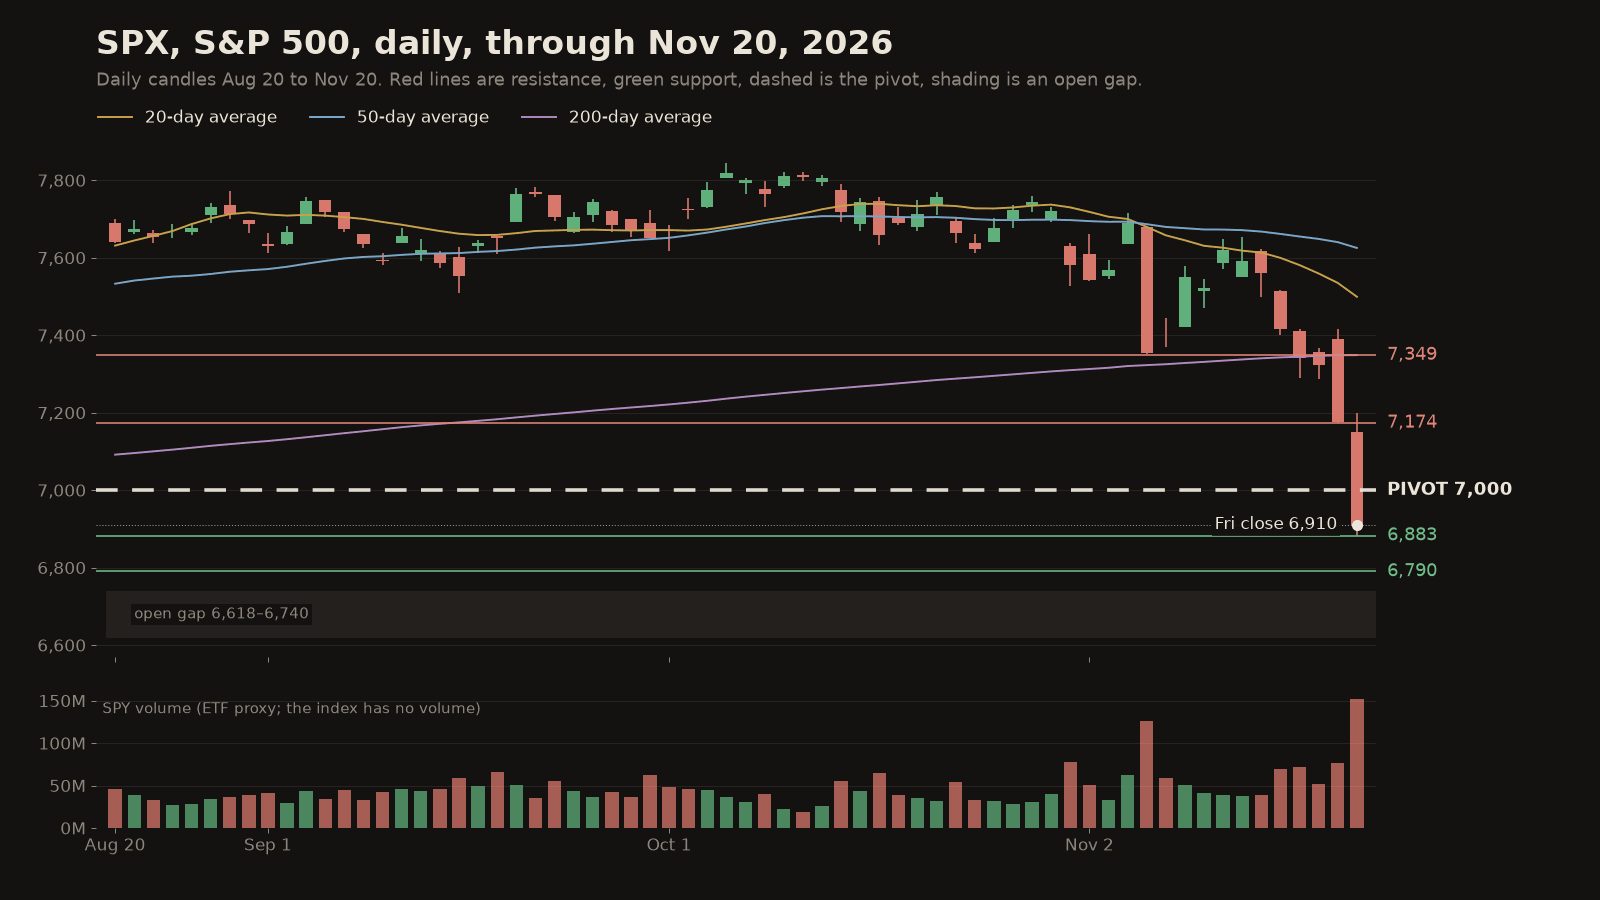
The index lost its 200-day average on Tuesday's close and never got it back, then fell 2.02% Thursday and 3.70% Friday. Friday opened at 7,150.39, under Thursday's 7,173.63 low, and the high stopped at 7,198.67. The 20-day average at 7,499 sits under the 50-day at 7,625, both falling, and price is below all three averages, about 11.9% under the Oct 6 high at 7,844.52. The pivot is 7,000, a round number and the strike with about 2.8 million contracts open, by far the most on the board; Friday closed about 1.3% below it. Above it, Thursday's low and the 200-day near 7,349 are the levels with history. Below, Friday's low at 6,882.66 and the Apr 13 low at 6,790.02 come first, and the gap the index left on Apr 8 is still open from 6,740 down to 6,618.
The Nasdaq 100
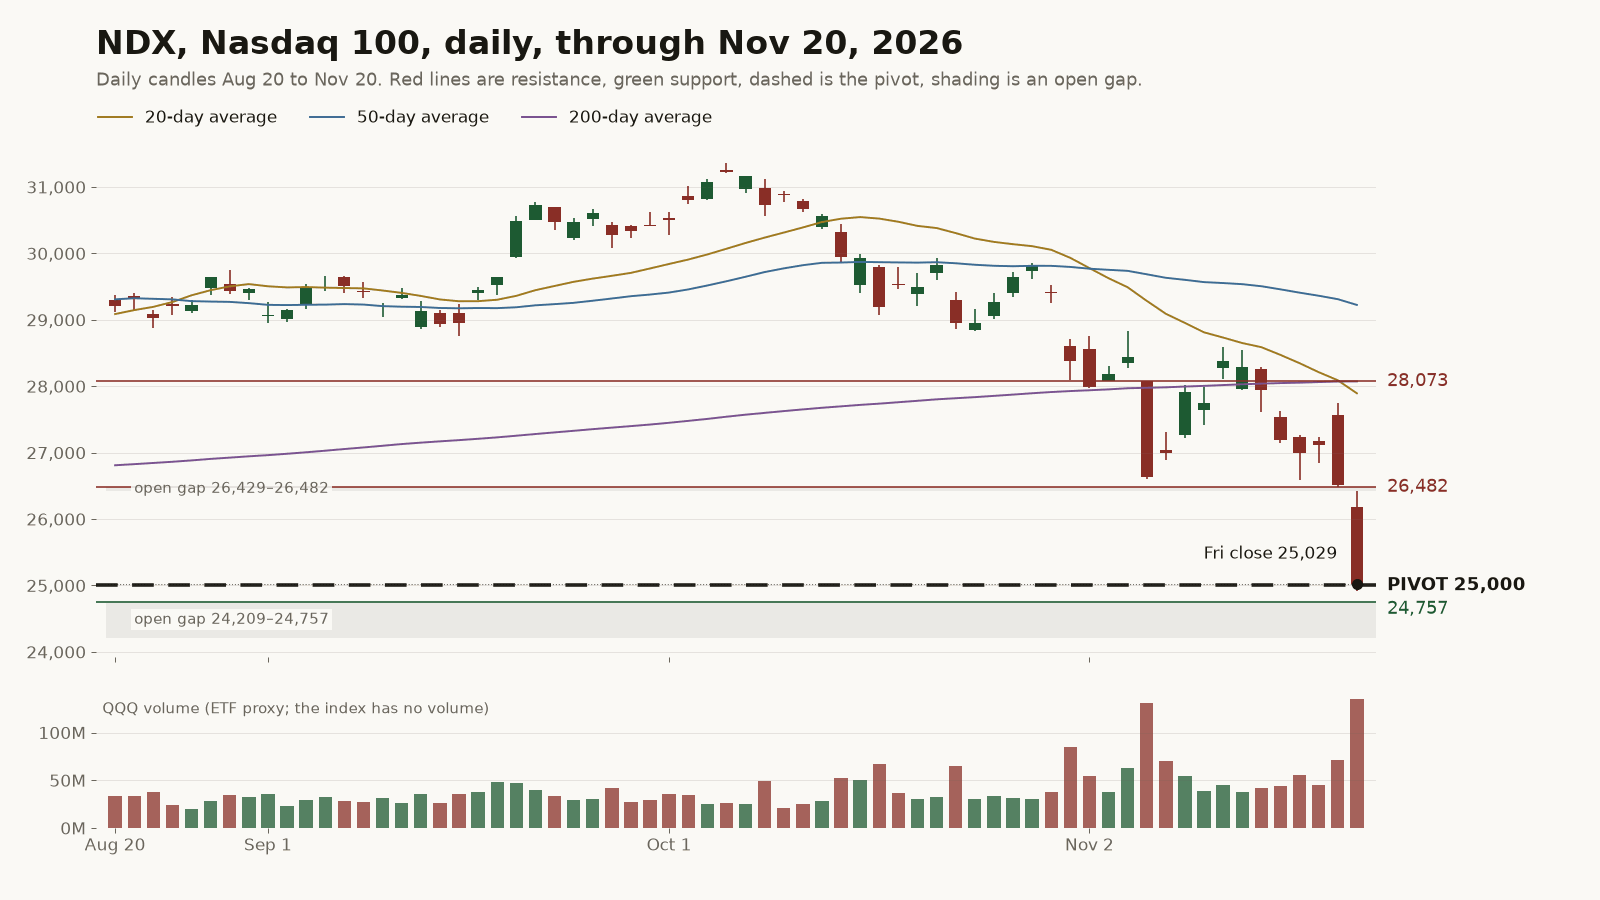
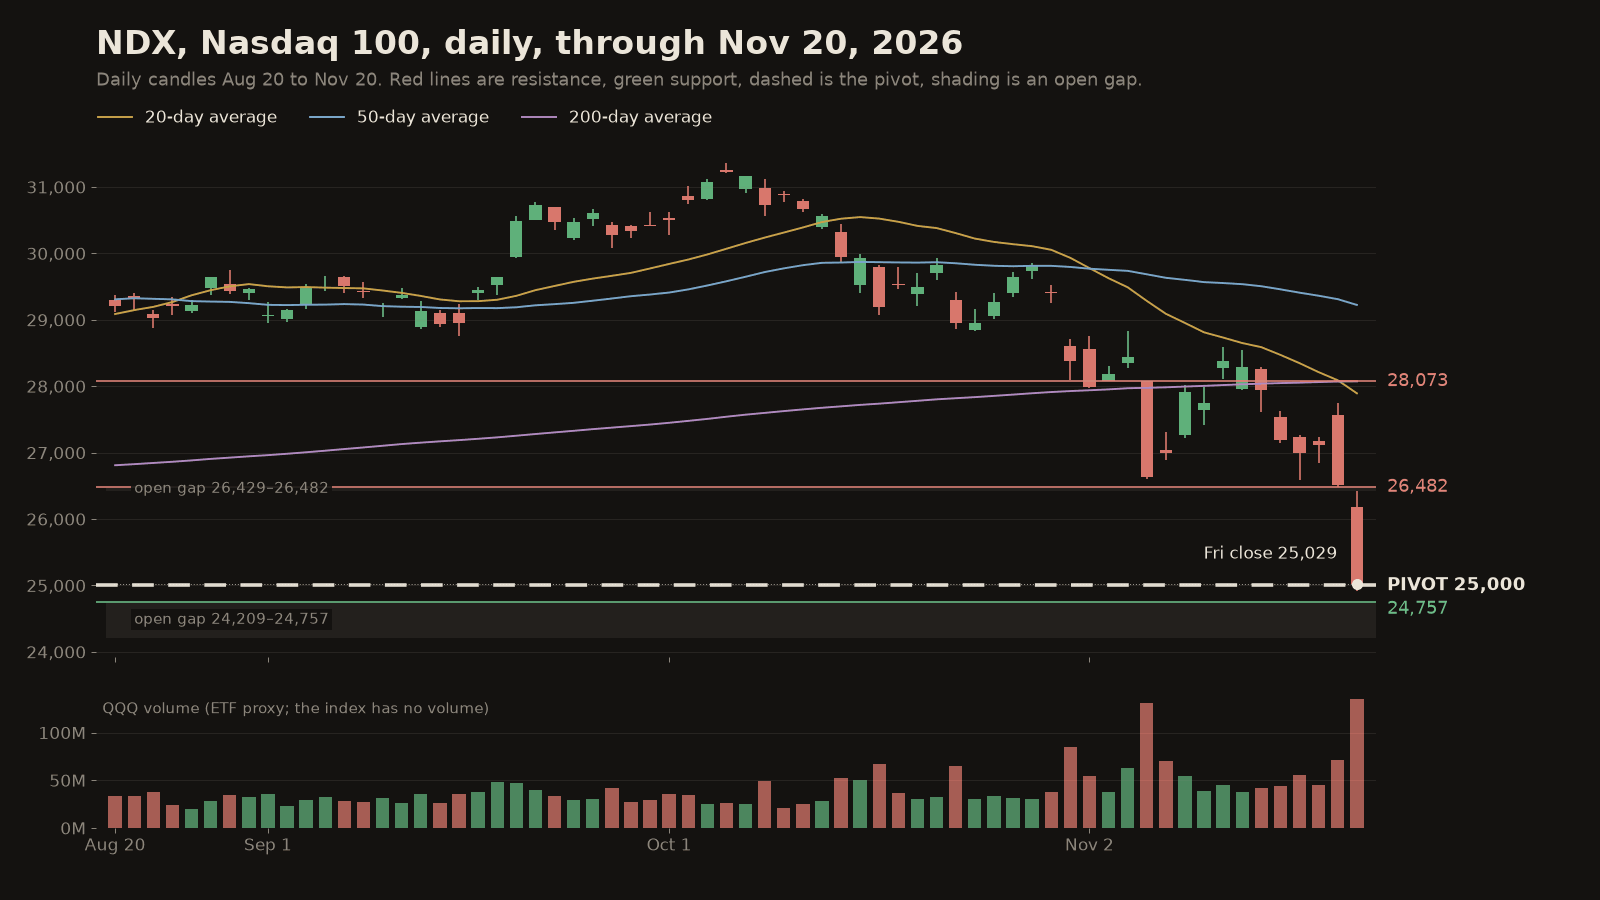
Tech lagged again, down 10.43% on the week against 8.61% for the S&P and 5.61% on Friday against 3.70%. The index has closed under its 200-day average, now 28,073, since Nov 13, and Friday's open left a gap from 26,429.09 to 26,481.82 under Thursday's low. The pivot is 25,000, a round number and the strike with the second-most open interest, mostly puts. Friday's low at 24,910.48 dipped under it, and the close held 29 points above. Below, the gap from Apr 8 is still open from 24,757 down to 24,209, the next level with history on this chart.
Nvidia after the report and the probe reports
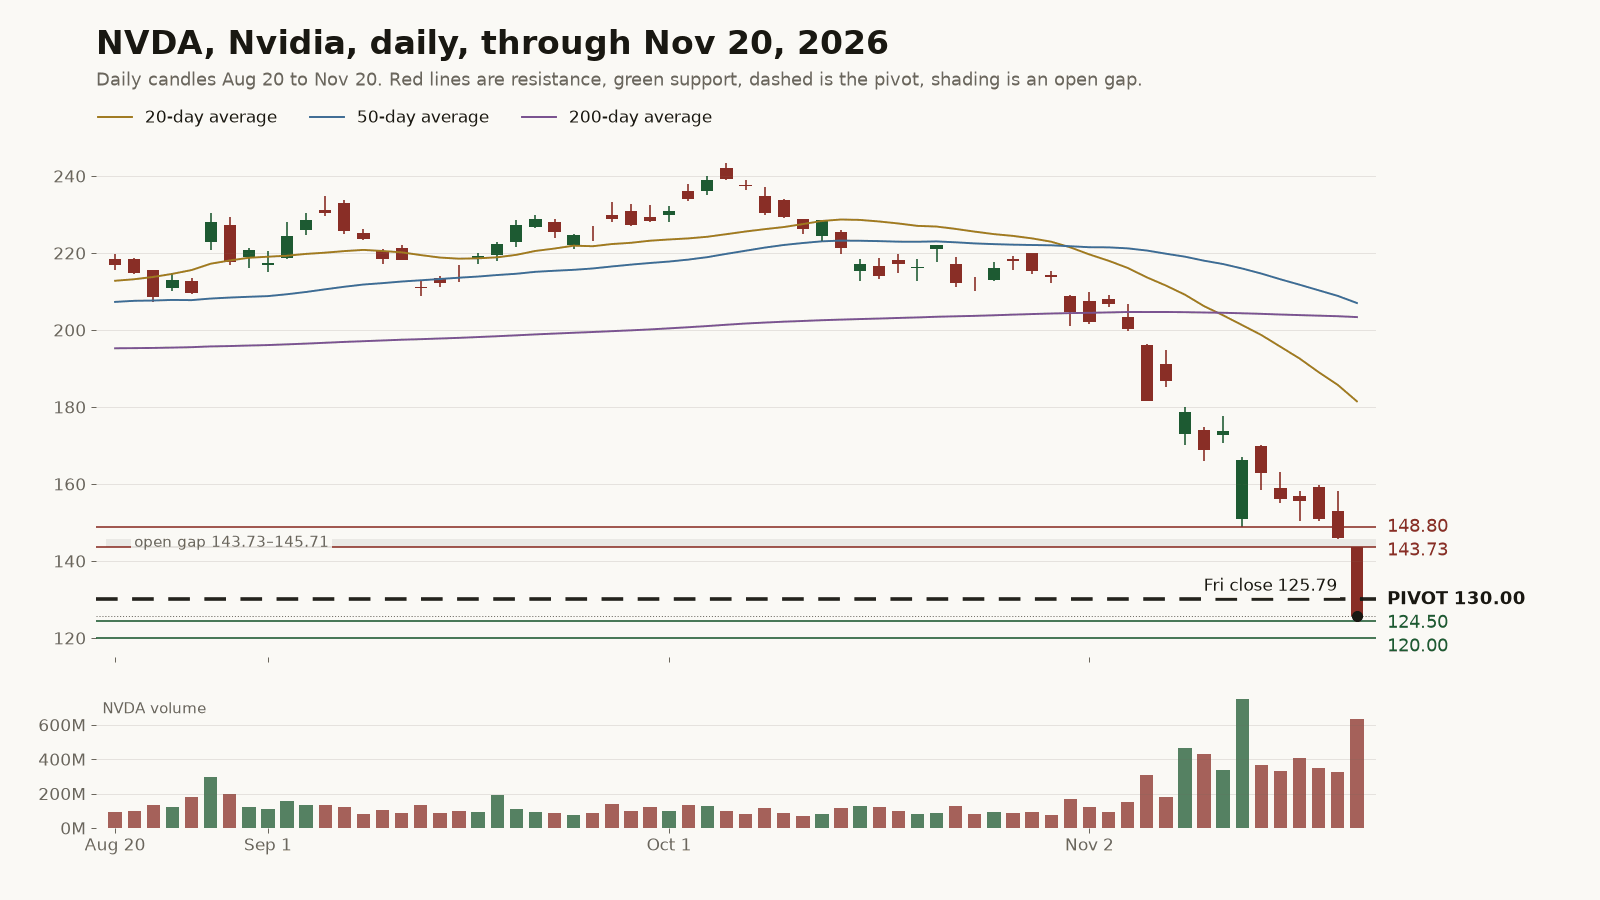
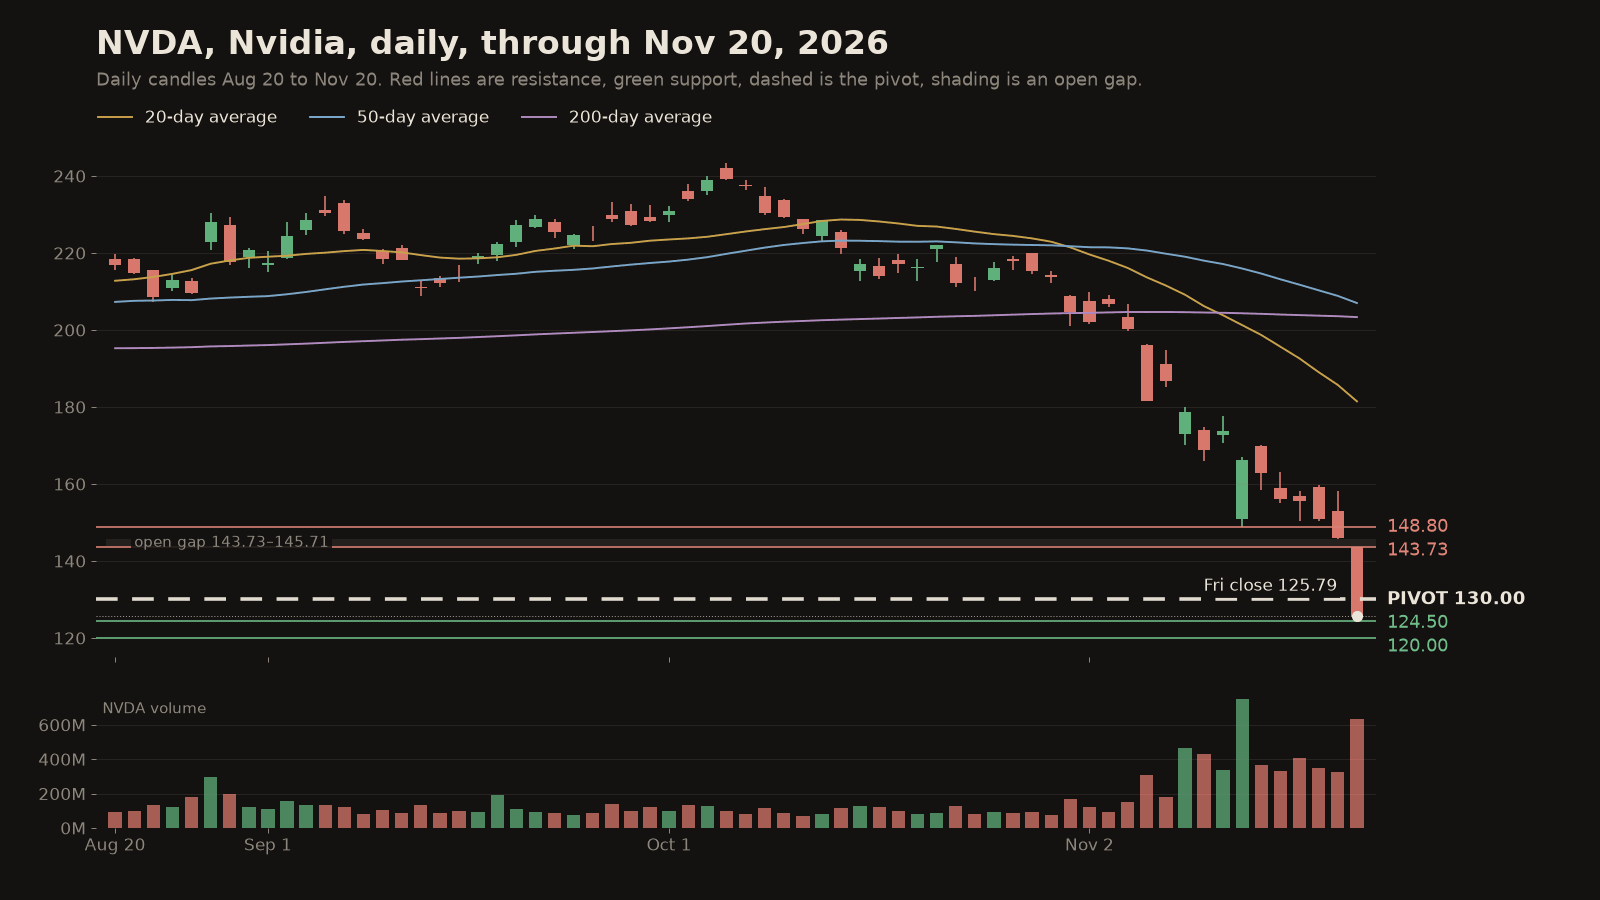
Nvidia made the board with a 22.76% weekly drop to 125.79, 13.83% of it on Friday, after a report Tuesday that beat estimates with $115.8 billion in sales and a reported SEC look at its accounting on Friday afternoon. Friday opened at 143.52, under Thursday's 145.71 low, leaving a gap that is still open, and the low hit 124.50, the lowest price on its chart since at least July 2025. The stock is about 48.3% under its Oct 6 high and about 38.1% under its 200-day average at 203.35. The pivot is 130, a round number with heavy put open interest; quotes showed the stock at 130.01 near 8 PM ET Friday, after the close. Above, Friday's 143.73 high and the Nov 12 low at 148.80, near the 150 strike with the most open interest, are the levels with history. Below, the 120 strike has about 360,000 puts open.
AMD after the short report
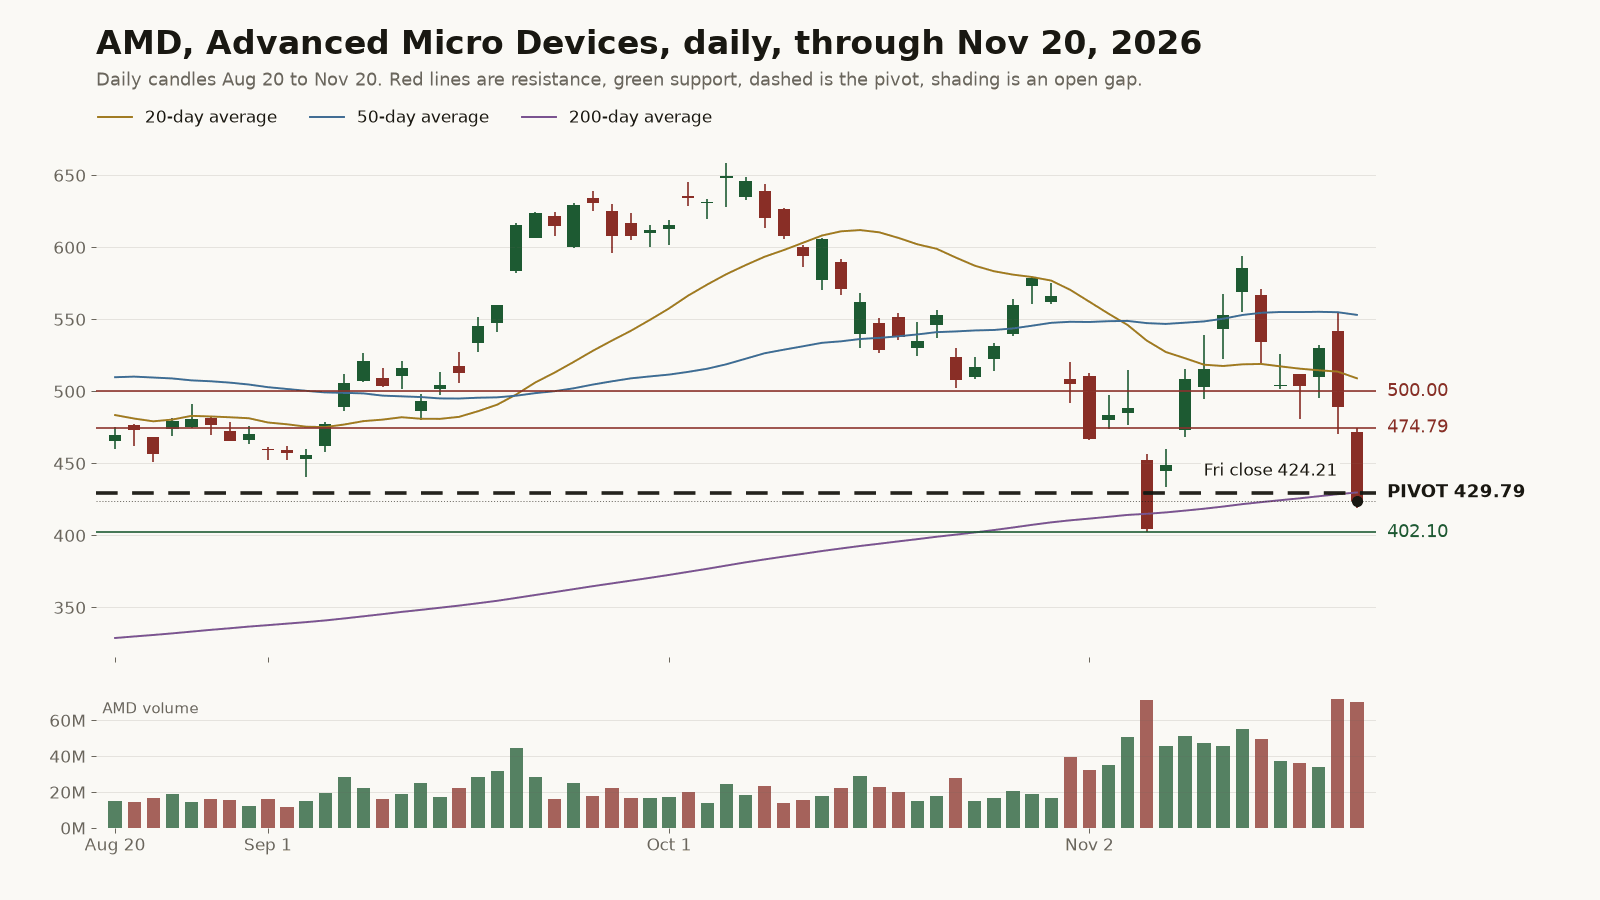
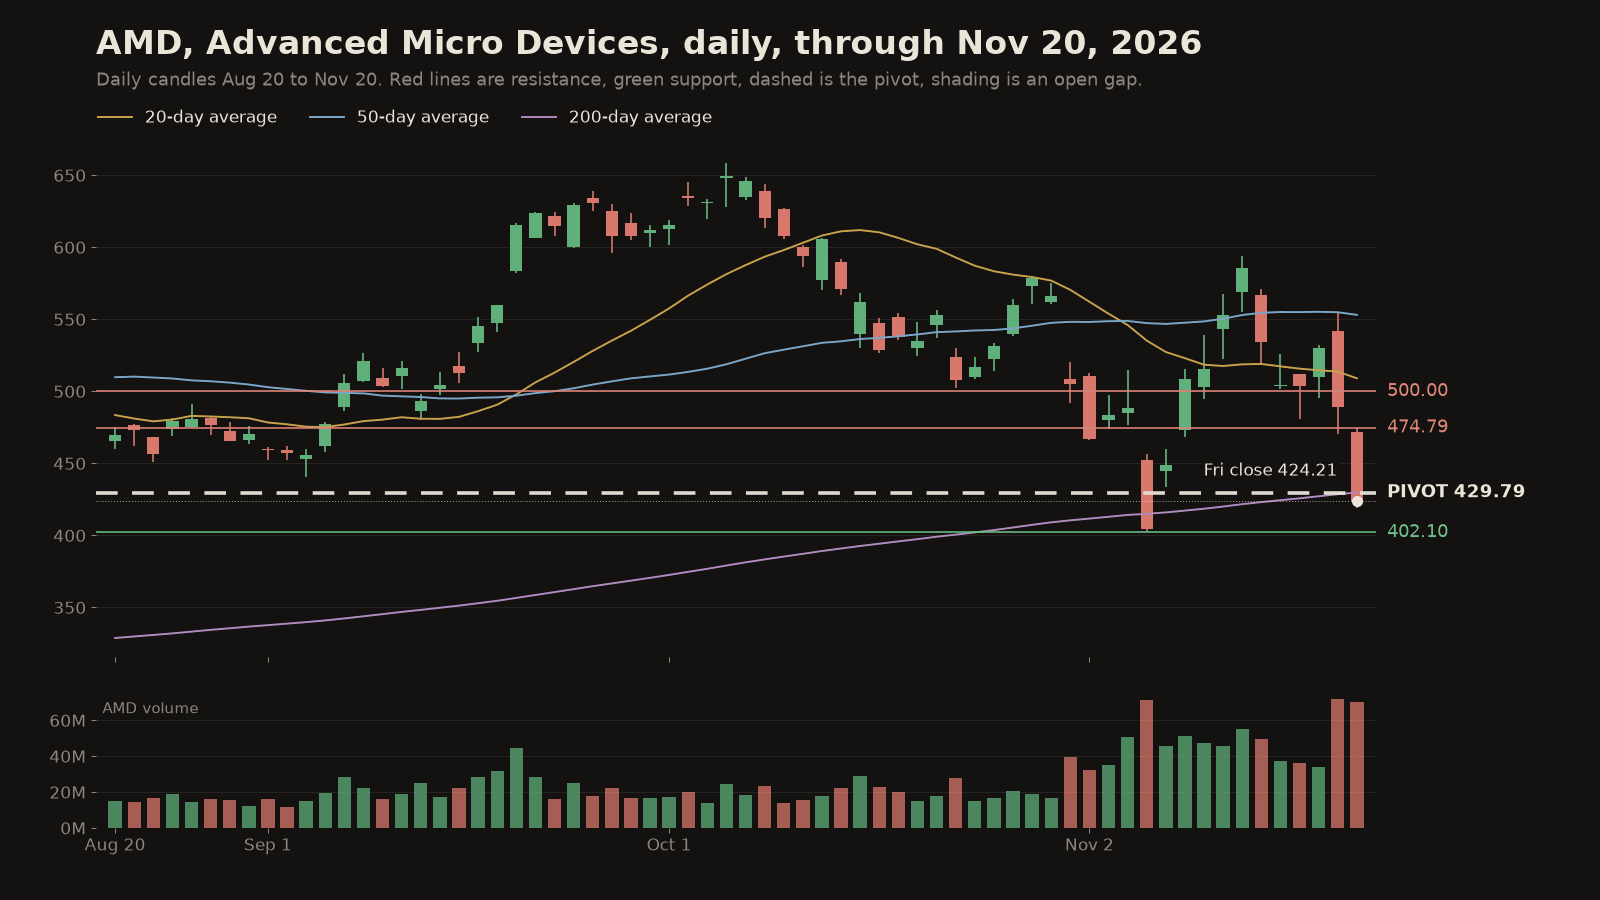
AMD made the board with a 20.57% weekly drop to 424.21. It fell 7.72% on Thursday after a short seller's report alleged China exposure, which AMD denied, then 13.28% on Friday as chip stocks sold off. Friday's close was its first under the 200-day average, now 429.79, since Nov 5, so that line is the pivot, with the 430 strike right on it. Above, Friday's 474.79 high and 500, the strike with the second-most open interest and last week's support, are the levels with history. Below, Friday's low at 418.76 and the Nov 5 low at 402.10, near the 400 strike with the most open interest, are the next lines.
Pivot moments next week
Monday's open is the first session after Friday's reports on Nvidia, and Hewlett Packard Enterprise reports after the close with options pricing a move of about 12.6%, alongside Agilent and Zoom: an early read for the Nasdaq 100's 25,000 and Nvidia's 130. Tuesday, Analog Devices reports before the open, priced for about 8.1%, a chip read for AMD's 200-day near 430, and Dell reports after the close, priced for about 13.9%, with Autodesk, Workday and HP. Wednesday at 8:30 AM ET brings the second estimate of third-quarter GDP and October personal income and spending, which carries the PCE inflation gauge, the macro test of the S&P's 7,000; Deere reports before the open. Markets are closed Thursday for Thanksgiving and close early at 1:00 PM ET on Friday, so Wednesday's close is the last full session of the week.
How to read these levels
These levels mark where the market has reacted before and may again. They are not predictions or trade signals. A daily close through a level says more than an intraday poke, an open gap tends to stay a reference point until price trades back through it, and a holiday week's thin trading can make both look bigger than they are.
- HeatingThe AI spending boomThe Nasdaq 100 fell 10.43% on the week and closed about 10.8% under its 200-day average, holding 25,000 by 29 points as chip names led the drop.
- HeatingNvidia's CEO shake-upNvidia closed at 125.79, down 22.76% on the week and about 38% under its 200-day average, with 130 the first line it has to win back.
SOURCES ›
- Earnings calendar, pulled 10:12 AM ET 2026-11-21: Mon 11/23 after the close HPE (expected move 12.56%), A (8.16%), ZM (9.15%); Tue 11/24 before the open ADI (8.11%), MDT (3.71%); Tue 11/24 after the close DELL (13.93%), ADSK (8.05%), WDAY (8.46%), HPQ (8.68%); Wed 11/25 before the open DE (6.46%). The economic calendar feed returned no rows for the week at that time.
- BEA release schedule (bea.gov/news/schedule), read 2026-11-21: Wed Nov 25 8:30 AM ET GDP (Second Estimate) and Corporate Profits, 3rd Quarter 2026; Personal Income and Outlays, October 2026.
- NYSE holidays and trading hours (nyse.com/markets/hours-calendars), read 2026-11-21: closed Thursday Nov 26 2026 for Thanksgiving; early close 1:00 PM ET (1:15 PM for eligible options) Friday Nov 27 2026.
- Nvidia Q3 FY2027 report 2026-11-17 after the close: revenue $115.8B vs about $109.1B est., adj EPS $2.68 vs $2.47 (event-nvda-2026-11-17).
- Index daily bars from quotes for SPX and NDX, Jul 1, 2025 to the Nov 20, 2026 close (4:00 PM ET); index quotes SPX 6,910.39, NDX 25,028.98. 20, 50 and 200-day averages computed from those closes: SPX 7,499.23, 7,625.26, 7,348.58; NDX 27,893.46, 29,224.27, 28,073.30. SPX 6,910.39 vs 7,561.67 Nov 13 (−8.61%), Thu −2.02% (7,175.83, low 7,173.63), Fri −3.70%, Fri open 7,150.39, high 7,198.67, low 6,882.66; first close under the 200-day Tue Nov 17 (7,340.53 vs 7,344.53); lowest close since Apr 13 (6,886.24); Apr 13 low 6,790.02; Apr 7 high 6,618.26 and Apr 8 low 6,740.28 (open gap); Oct 6 high 7,844.52 (−11.91%). NDX 25,028.98 vs 27,943.74 (−10.43%), Fri −5.61%, Thu low 26,481.82, Fri high 26,429.09, Fri low 24,910.48; last close above the 200-day Nov 12; lowest close since Apr 8 (24,903.17); Apr 7 high 24,209.28, Apr 8 low 24,756.93 (open gap); Oct 6 high 31,361.37 (−20.19%). Gaps, highs and lows from the same bars.
- Equity daily bars from quotes for SPY and QQQ (volume panels), NVDA and AMD, Jul 1, 2025 to Nov 20, 2026; Friday closes are the official 4:00 PM ET prices from quotes: NVDA 125.79, AMD 424.21 (424.205), SPY 690.91, QQQ 610.04. NVDA vs 162.85 Nov 13 (−22.76%), vs 145.98 Thu (−13.83%), Fri open 143.52, high 143.73 (143.725), low 124.50, Thu low 145.71, Nov 12 low 148.80, Oct 6 high 243.37 (−48.31%); 20/50/200-day 181.47, 207.01, 203.35; no lower bar in the series back to Jul 1, 2025; evening-session quote 130.01 at about 7:59 PM ET Nov 20. AMD vs 534.06 (−20.57%), Thu 489.19 (−7.72%), Fri −13.28%, high 474.79, low 418.76; Nov 5 low 402.10, close 404.40 (under the 200-day 415.00); 20/50/200-day 509.07, 553.09, 429.79.
- Options open interest by strike, as of the Nov 20 close, pulled 10:12 AM ET 2026-11-21: SPX 7,000 (1,343,773 calls, 1,448,625 puts, the most by far), 6,800 (145,042 puts); NDX 27,000 (5,711 total, the most), 25,000 (200 calls, 3,955 puts, second); NVDA 150 (867,245 total, the most), 130 (66,572 calls, 284,621 puts), 120 (360,342 puts); AMD 400 (116,070 total, the most), 500 (98,296, second), 430 (41,756).
- Week changes are Fri Nov 20 close vs Fri Nov 13 close; daily changes close to close. Closing mood from data/market/day-moods.json (2026-11-20 bleeding).
- Charts: drawn from the same daily bars and open interest, Aug 20 to Nov 20, 2026.
- @FirstSquawk — “Nvidia Faces SEC Scrutiny Over Possible Accounting Issues, According to RTRS”
- @zerohedge — “SEC PROBE INTO NVIDIA IS EXPLORING POTENTIAL ACCOUNTING ISSUES, ACCORDING TO SOURCES: RTRS”
- @CNBC — “AMD falls on short-seller report of alleged China exposure”
- @YahooFinance — “$AMD fell about 6% after a short-seller report claimed the chipmaker has a “China problem,” which AMD denied.”
Get tomorrow's feature in your inbox.
One feature a day, every day. Free. Unsubscribe anytime. Privacy